
Macro Stress: Market Monitor

There seem to be two dominant ways of talking about the U.S. market right now.
One says the market is dangerously overvalued, AI is a bubble, debt is unsustainable and a major correction is inevitable. The other says earnings are strong, AI infrastructure spending is a new investment cycle, the largest technology companies are extraordinarily profitable, and the market can keep making new highs.
I am sceptical of both.
Markets can stay expensive for a very long time. Strong companies can become stronger. An index sitting near an all-time high also does not mean the financial system underneath it is becoming safer.
Most of the discussion collapses this into one question: will the market crash? I think that is the wrong question. A more useful one is: where is stress actually building, and is it beginning to transmit from one part of the system into another?
That is why I built Macro Stress.
Why now?
The 2026 U.S. midterms were the trigger for building this now.
Midterms do not mechanically cause market crashes. Politics is not a trading signal, and history is full of exceptions. Midterm years have still tended to be bumpier, with drawdowns inside the year that are large enough to matter.
Hartford Funds calculates an average maximum drawdown of 16.8% across the past ten midterm cycles. Some were relatively benign. Others were not: roughly 20% in 1990, 19% in 1998, 34% in 2002, 20% in 2018 and 25% in 2022.
October appears repeatedly in that history. The market reached significant midterm-year lows on 11 October 1990, 9 October 2002, 15 October 2014 and 12 October 2022. That does not make October a forecast. It does make the period worth watching.
Looking further back, analysis cited by Reuters found that the S&P 500 fell at least 5% during the September-to-October period in 15 of the 24 midterm years since 1930.
The second half of that pattern matters just as much. Fidelity notes that since 1938 the S&P 500 has risen over the following 12 months in roughly 95% of midterm cycles. Schwab calculates an average gain of 12.4% in the six months following midterms since 1974.
So I am not saying “midterms mean sell.” It is almost the opposite.
Midterms create a stress window in which understanding what is actually deteriorating may matter more than predicting the election itself.
The market is unusually concentrated
When people say “the stock market is strong,” that strength increasingly reflects a small group of very large companies.
As of 31 August, S&P Dow Jones Indices reported that the ten largest constituents represented 37.8% of the entire S&P 500. Information technology alone represented 37.9%. Nvidia, Apple, Microsoft, Amazon, Alphabet, Broadcom, Meta, Micron and Tesla dominate the top of the index.
That matters because the S&P 500 is market-capitalisation weighted. A $5 trillion company moving 5% matters enormously more to the index than a normal American company moving 5%.
You can see the gap under the headline index now. In September, while the S&P 500 remained close to record levels, Reuters reported that only three of its eleven sectors were positive for the month and an equal-weighted version of the index had fallen approximately 4%.
I would not call that bearish. But it is different from a broad market in which strength is being confirmed across hundreds of companies. A cap-weighted index can remain extremely strong while conditions underneath it become less uniform.
The AI capital cycle
Those companies got this big for a reason. The AI investment cycle is enormous. Morgan Stanley estimated that the largest U.S. hyperscalers could spend more than $600 billion in 2026 alone on AI infrastructure.
A handful of technology companies are now spending roughly as much on capital equipment as every non-technology company in the S&P 500 did in 2025. This is real economic activity: data centres, semiconductors, networking equipment, cooling, power generation, transmission, construction and financing.
The fact that the spending is real does not make me comfortable with the scale or the dependencies being created around it.
My concern is less that this is simply “dot-com 2.0” and more that an increasingly large part of the market is being built around the same set of assumptions: demand for frontier AI keeps growing, customers remain willing to pay for access, hyperscalers continue deploying capital at extraordinary rates, and the economics eventually justify the infrastructure being built underneath it.
None of those assumptions is guaranteed, and increasingly they depend on one another.
The model layer is already becoming more competitive and, potentially, more commoditised. Open-weight and lower-cost models keep improving, which could compress pricing and margins at the model layer faster than the cost base underneath it — GPUs, data centres, power and financing — can adjust. At the same time, the industry is becoming increasingly interconnected. Chip manufacturers, cloud providers, AI labs, infrastructure companies and their financiers increasingly sit on multiple sides of the same transactions: investor, supplier, customer and counterparty.
That interconnectedness is more interesting to me than the usual question of whether AI is simply a bubble.
If a major model provider cuts spending, struggles to finance its commitments, loses demand to cheaper alternatives, or discovers that frontier-model economics do not support the infrastructure built around expected demand, the impact does not necessarily stop with that company.
The stress can then move into cloud providers and data-centre operators, GPU and infrastructure financing, semiconductor demand, power projects, private credit and infrastructure lending.
There is also a regulatory and governance variable that financial models struggle to price. Some of the people building the most capable systems are simultaneously arguing for stronger governance, tighter controls and greater caution around frontier AI. Those concerns may be entirely justified, but they create an obvious tension with financial models built around uninterrupted exponential deployment.
So the risk is not simply that Nvidia, Microsoft or Amazon are expensive.
It is that an enormous amount of capital, debt capacity and expected future cash flow is becoming attached to the same technological and economic thesis.
And if one important assumption in that chain breaks, it can become somebody else's balance-sheet problem.
That is exactly what I want Macro Stress to help me detect: not whether AI is a bubble, but whether stress originating in one part of the system remains isolated or begins transmitting into credit, funding, liquidity and the broader economy.
Valuation matters more when money is expensive
Valuation alone is a poor short-term timing tool. Something being expensive does not tell you when it will become cheaper. Valuation behaves differently when the risk-free rate changes.
At the beginning of October, the S&P 500's forward P/E was around 19.2x, down from roughly 22x earlier in the year. The cyclically adjusted Shiller P/E was above 41x. Those numbers become more interesting when a 10-year Treasury is yielding more than 5%.
The latest Macro Stress observation had the 10-year Treasury at 5.24% and the 10-year real yield at 2.88%. That is very different from valuing long-duration assets in a zero-rate environment.
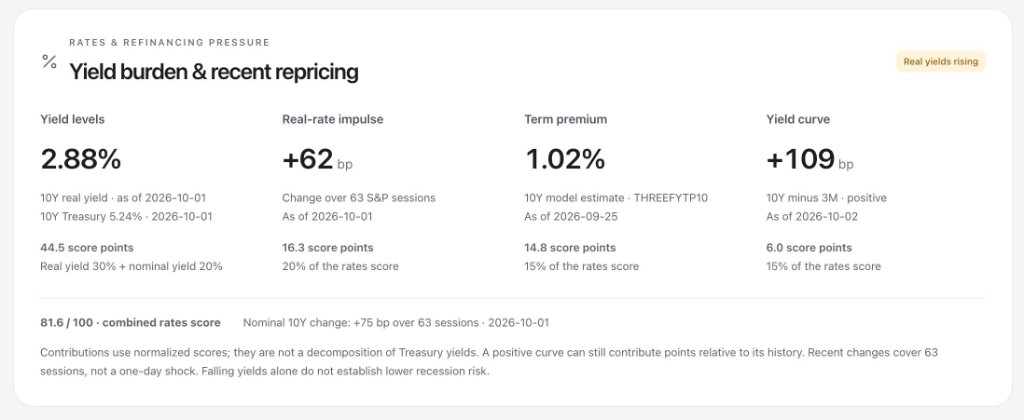
Higher real yields raise the discount rate on future cash flows, corporate borrowing costs and hurdle rates for private equity and infrastructure. Eventually, higher discount rates and financing costs transmit into credit. That transmission is more interesting to me than whether the S&P is on 19x, 22x or 25x earnings.
Credit is where the story becomes useful
This is also the part of the market I actually spend my time in: private credit, asset-backed finance and asset-based lending.
For an ABL lender, the level of the S&P 500 itself is almost irrelevant. What matters is what happens next. A weaker economy can start showing up as slower customer payments. Slower payments increase receivables ageing, and that can reduce borrowing-base eligibility. Consumer weakness can increase returns, discounts or bad debts, increasing dilution. Inventory can take longer to move or become obsolete, and customer concentrations become more dangerous. Excess availability under the revolver can contract at exactly the point at which the borrower needs liquidity most.
The OCC's ABL handbook focuses on precisely these issues: eligible collateral, advance rates, dilution, receivable concentrations, inventory quality, borrowing-base controls and excess availability.
For asset-backed finance, the collateral changes but the transmission mechanism is similar. Auto loans, consumer receivables, equipment, residential credit and specialty-finance portfolios each have their own underwriting models, but eventually macro conditions appear in delinquencies, defaults, recoveries, prepayments, collateral values, excess spread, financing costs and warehouse availability.
This is why I do not think an equity-only risk dashboard is enough.
What Macro Stress actually does
Macro Stress is a cross-asset stress monitor, not a market-direction model.
It takes observations across the financial system, normalises them against their own historical distributions and groups them into broader risk families. The current model processes 79 features across rates, credit, market prices, volatility, inflation, energy, funding, bank lending, labour and liquidity.
Each observation is compared with its own history. Those 79 features currently sit on roughly 2.8 million historical observations. Where sufficient history exists, daily-series scoring uses up to roughly ten years of observations rather than comparing today's market with only the most recent regime. The underlying database extends much further for some series: the 10-year Treasury yield reaches back to 1962 and the VIX to 1990. Other series are much shorter. The current high-yield and investment-grade spread history begins only in September 2023, so those comparisons have materially less historical depth. I would rather expose that limitation than manufacture confidence the data cannot support.
A score of 50 does not mean a 50% probability of a crash. It means roughly normal relative to that variable's historical distribution.
One extreme indicator is deliberately not enough to declare a crisis. The important question is whether stress is transmitting.
Is stress visible only in rates? Has it reached credit spreads? Are funding conditions deteriorating? Are equities confirming it? Is volatility changing? Are bank lending conditions tightening? Is liquidity beginning to deteriorate?
Financial accidents rarely arrive everywhere at once.
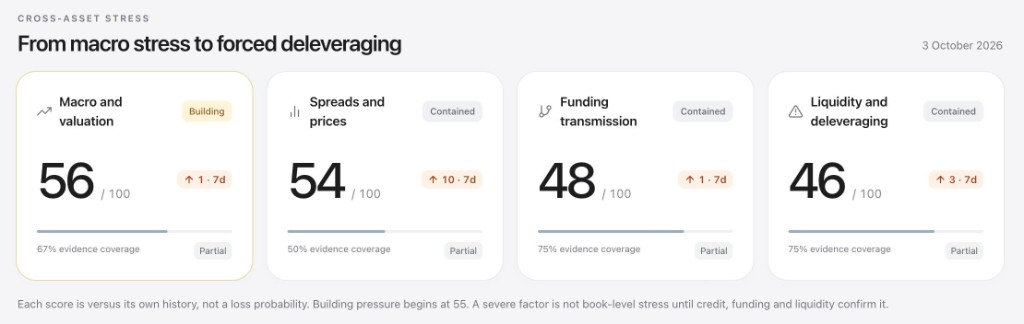
And right now, the answer is: not yet
This is exactly the kind of reading I built it for.
As of the 4 October 2026 report, rates are Severe, with a score above 80. Credit spreads are Elevated. High-yield option-adjusted spreads were around 324 basis points, having widened by approximately 44 basis points over five sessions. Real yields have moved sharply higher.
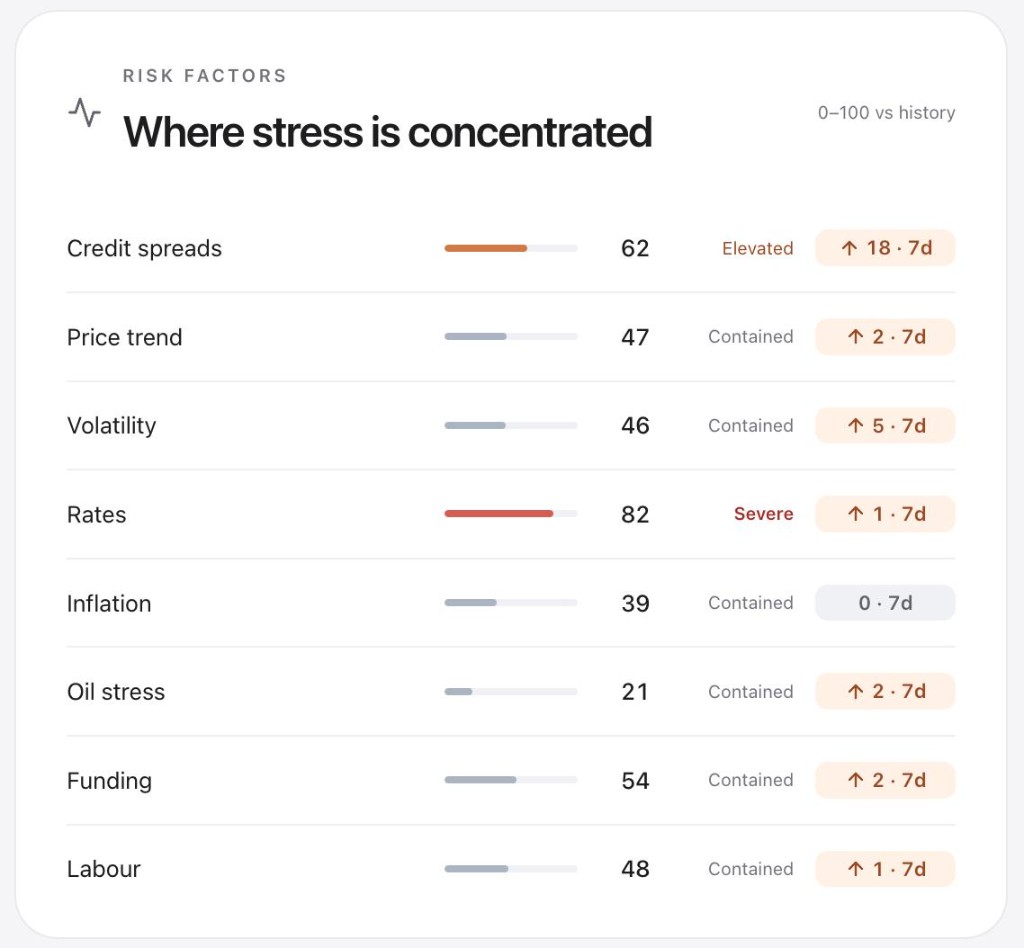
The other parts of the system have not confirmed broad financial transmission. Price trend, volatility, funding, and liquidity and deleveraging all remain contained.
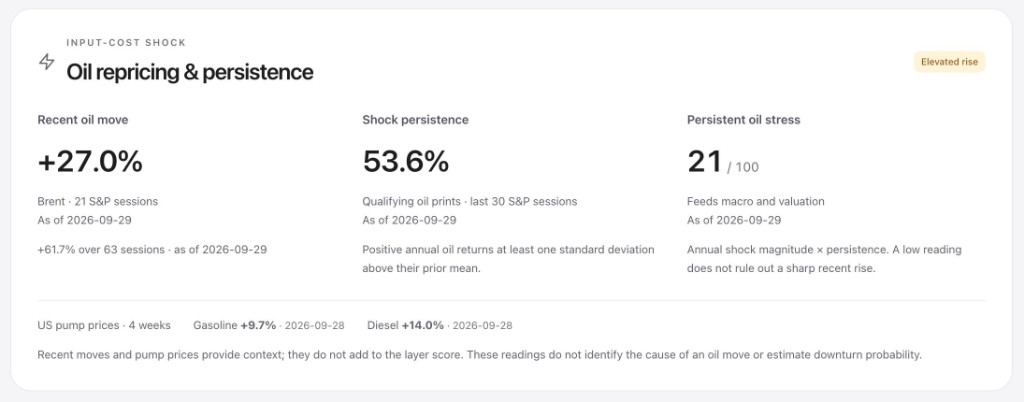
Oil illustrates the same distinction. Brent has jumped, and the oil-stress score is still contained. A sharp move in one market does not, by itself, mean stress is propagating through the system.
The desk read says: “Concentrated, not systemic.”
That is more useful to me than either “everything is fine” or “the crash is coming.” There are signs of pressure. It has not spread through the rest of the system.
Credit is not confirming systemic stress
The underlying lending data remains mixed rather than broadly distressed.
Commercial-bank business-loan delinquency was 1.24% in Q2 2026, down from 1.36% in the first quarter. The Federal Reserve's July Senior Loan Officer Opinion Survey found that banks had, on balance, left standards for commercial and industrial loans broadly unchanged during the second quarter, while demand from large and middle-market borrowers strengthened.
Household credit looks worse. The New York Fed reported that 4.7% of household debt was in some stage of delinquency in Q2, with new delinquencies for auto loans and credit cards remaining elevated even though aggregate delinquency measures were broadly stable.
Private credit presents the same mixed picture. There are stressed loans, restructurings and non-accruals, but the evidence does not currently support calling the entire market distressed.
That is why I want confirmation somewhere else in the system before I call it a broader problem.
What I am watching through the midterms
For the next few weeks, I care less about whether the S&P moves 2% higher or lower than whether the relationships underneath it begin to change.
I am watching whether high-yield spreads keep widening; whether the gap between high-yield and investment-grade credit accelerates; whether high real yields persist; whether equity breadth deteriorates further; whether volatility confirms weaker prices rather than remaining suppressed; whether lending standards and funding conditions begin tightening; and whether stress starts appearing more visibly in private-credit and asset-backed portfolios.
If those remain contained while rates stabilise, this may be another bout of pre-election volatility inside a fundamentally strong market. If those indicators begin deteriorating together, the interpretation changes.
That is the entire point.
I don't want Macro Stress to predict the future
There is a temptation with a system like this to collapse everything into one impressive-looking number. A 37% probability of recession. A 62% probability of a correction. Crash risk: high.
I do not want to do that without enough historical evidence to justify it. Macro Stress does not print a downturn probability. I do not yet have enough validated, out-of-sample history to defend one.
Missing data is shown as missing rather than silently converted into zero. Evidence coverage is shown. Inputs and calculations are exposed. The system tells you what it does not know.
In finance, pretending you know is worse than showing the gap.
The point isn't to be bearish
I am sceptical of the certainty with which both market narratives are being pushed. Do I think parts of this market look unusually fragile? Yes. Do I know where or whether that fragility will break? No. That is why I built Macro Stress: to replace conviction with measurement where I can.
The U.S. economy can remain strong. AI investment can continue. Corporate earnings can grow. The market can make another all-time high. History suggests the period after a midterm election has often been extremely good for equities.
Markets can remain strong while vulnerabilities accumulate underneath the headline indices.
So rather than choosing between an imminent financial apocalypse and an indefinite rally, I wanted something more boring: a system that keeps checking the evidence.
Rates. Credit. Funding. Liquidity. Volatility. The real economy. And eventually, the underlying private-credit and asset-backed markets themselves.
No doomsday clock. No permanent bull case. Just an attempt to understand whether stress is isolated, broadening, transmitting, or actually becoming systemic.
That is what I built Macro Stress for.